
Embrace the power of infographics
Think about the last time you scrolled through a news site or LinkedIn. Did you find yourself stopping to read blocks of text, or did your eyes dart to something a bit more visual, a chart, an illustrated summary, or a splash of colour?
Let’s face it: words alone can start to feel heavy fast. Even the most insightful articles can blend together if they don’t give the reader a break or point of focus.
Infographics cut through all that noise. They’re not just for decoration. When you pair strong ideas with well-considered visuals, you turn even the driest reports into something people remember, and make sure your key points don’t get lost by the time the reader reaches the end of the page.
Why Infographics Work
Grab attention
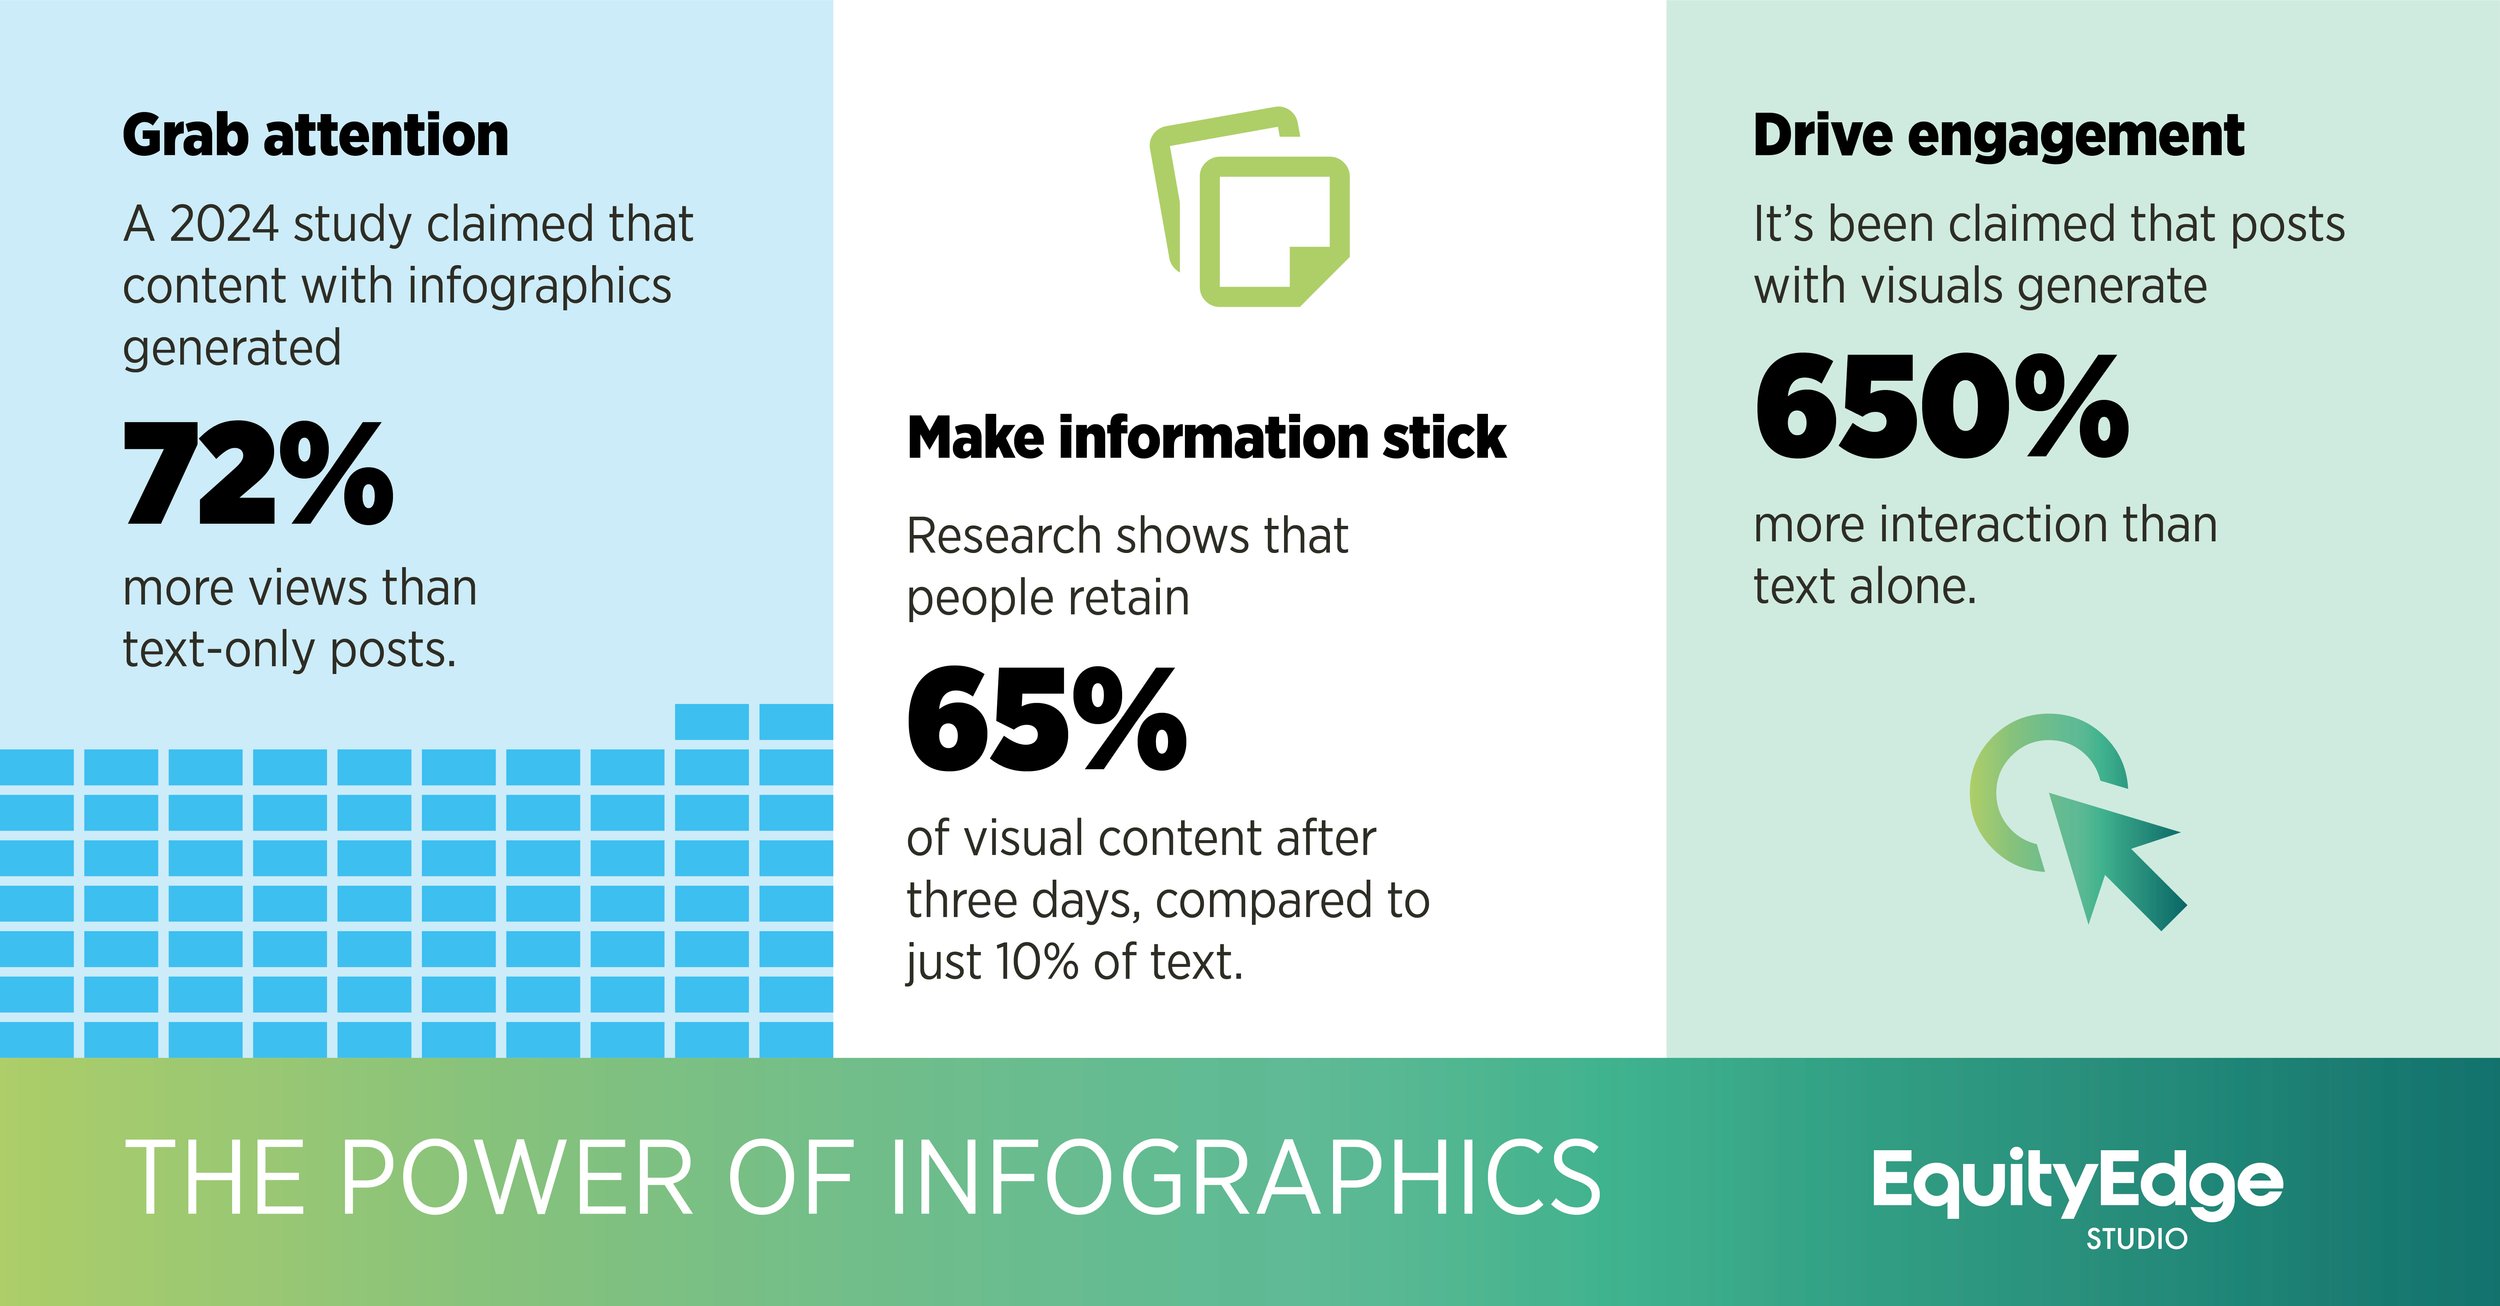
Humans are wired to process images far faster than words. In a crowded social media feed or on a busy website, a well-designed infographic can stop your reader in their tracks and convey key insights in a couple of seconds. A 2024 study claimed that content with infographics generated 72% more views than text-only posts[1], and, on platforms like X, they consistently trend higher thanks to their shareable nature.
Drive engagement
It’s been claimed that posts with visuals generate 650% more interaction than text alone[2].
Reinforce your brand
For businesses and content creators, infographics are a powerful way to reinforce your brand identity, weaving your logo, colours and voice into a visual.
Make information stick
Beyond grabbing attention, infographics make information stick. Research shows that people retain 65% of visual content after three days, compared to just 10% for text[3].
Build trust and credibility
By presenting well-researched data in a polished format, infographics position you as an authority in your field, building trust and credibility.
Go viral
Shareability rules, and infographics are built for it. Their compact, eye-catching format makes them perfect for platforms like X and LinkedIn. An infographic can spark a wave of shares, likes and retweets, spreading your message far beyond your immediate audience. This viral potential not only boosts visibility but also drives traffic back to your website and brand.
Simplicity is key
In a world where attention is fleeting and information is abundant, infographics stand out as a powerful tool for turning data into memorable visuals. Each of our infographics is built around one idea, made clear through careful design choices, like enough space between sections, calm colour schemes, or just the right headline to frame the story.
I bet you took more out of the infographic above than the previous text, our case in point!
Versatility
At EquityEdge Studio, we see infographics as your hardest-working asset. You can use them pretty much anywhere: in an annual report, a quick LinkedIn update, an internal team presentation, or as the star of a new white paper. The best infographics don’t try to do too much at once.
A flexible infographic isn’t stuck on one platform, either. You might include it in a PDF, drop it into a slide deck, or use a cut-down version to catch attention as someone scrolls past on social media. They scale and adjust to whatever shape your project takes, helping your message land every time.
Make content that works harder
Great ideas deserve more than just words. With infographics, you’re not just filling space, you’re giving your audience a visual shortcut to understanding and remembering what matters. If dry reports and endless paragraphs aren’t getting the results you want, maybe it’s time to try a different approach.
If you want to see what smart visuals can do for your brand, let’s talk. We help financial services teams turn complex ideas into content people actually want to read.
[1] https://www.singlegrain.com/infographic/why-infographics-are-the-best-content-investment-youll-ever-make/
[2] https://www.sproutworth.com/visual-content-marketing-statistics/
[3] https://www.wearecognitive.com/blog/effectiveness-visual-storytelling#:~:text=The%20Rising%20Dominance%20of%20Visual%20Media&text=Furthermore%2C%20research%20by%20John%20Medina,10%25%20retention%20with%20text%20alone.